
Yield Tracking in Food Manufacturing: How to Control Yield, Reduce Wastage & Protect Margins
Yield Tracking in Food Manufacturing: How to Control Yield, Reduce Wastage & Protect Margins
“You think your margin problem is a sales problem.
It’s not. It’s a yield problem.”
Many mid-size bakery and ready-to-eat (RTE) manufacturers experience:
-
3–8% unexplained production variance
-
Inconsistent batch outputs
-
Raw material overconsumption
-
Margin fluctuations despite stable pricing
Revenue may be stable. Orders may be growing. But profitability feels unpredictable.
This is where yield tracking in food manufacturing becomes critical.
Most businesses track:
-
Sales
-
Revenue
-
Raw material purchase costs
Very few track:
-
Planned yield vs actual yield
-
The cost of rework
-
Moisture loss during baking
-
Trim waste
-
Batch-level production variance
Without structured food production wastage control, margin in food manufacturing becomes guesswork.
And here’s the reality:
If yield isn’t measured at the batch level, it cannot be controlled.
What Yield Tracking in Food Manufacturing Actually Means
Yield tracking is often reduced to a formula. In practice, it is a financial control mechanism.
The Real Formula
Planned Yield % = (Expected Output / Input) × 100
Actual Yield % = (Actual Output / Actual Input) × 100
But in bakery and RTE manufacturing, this must be applied per batch, per SKU, per shift.
Example:
| Metric | Planned | Actual |
|---|---|---|
| Flour Issued | 100 kg | 100 kg |
| Finished Output | 92 kg | 88 kg |
| Yield % | 92% | 88% |
That 4% variance is not operational noise. It is margin erosion.
Why Most Bakeries Get This Wrong
In mid-size food manufacturing environments:
-
Recipes are stored in Excel
-
No live reconciliation between issue and output
-
Raw material issue is not linked to finished goods receipt
-
Moisture evaporation is not standardized
-
Scrap is not recorded properly
-
Rounding errors occur daily
The result?
Production appears normal. Margin quietly declines.
Key Takeaway: Yield tracking is not about formulas. It is about structured batch reconciliation.
The 7 Silent Yield Leakage Zones in Bakery & Ready-to-Eat Manufacturing
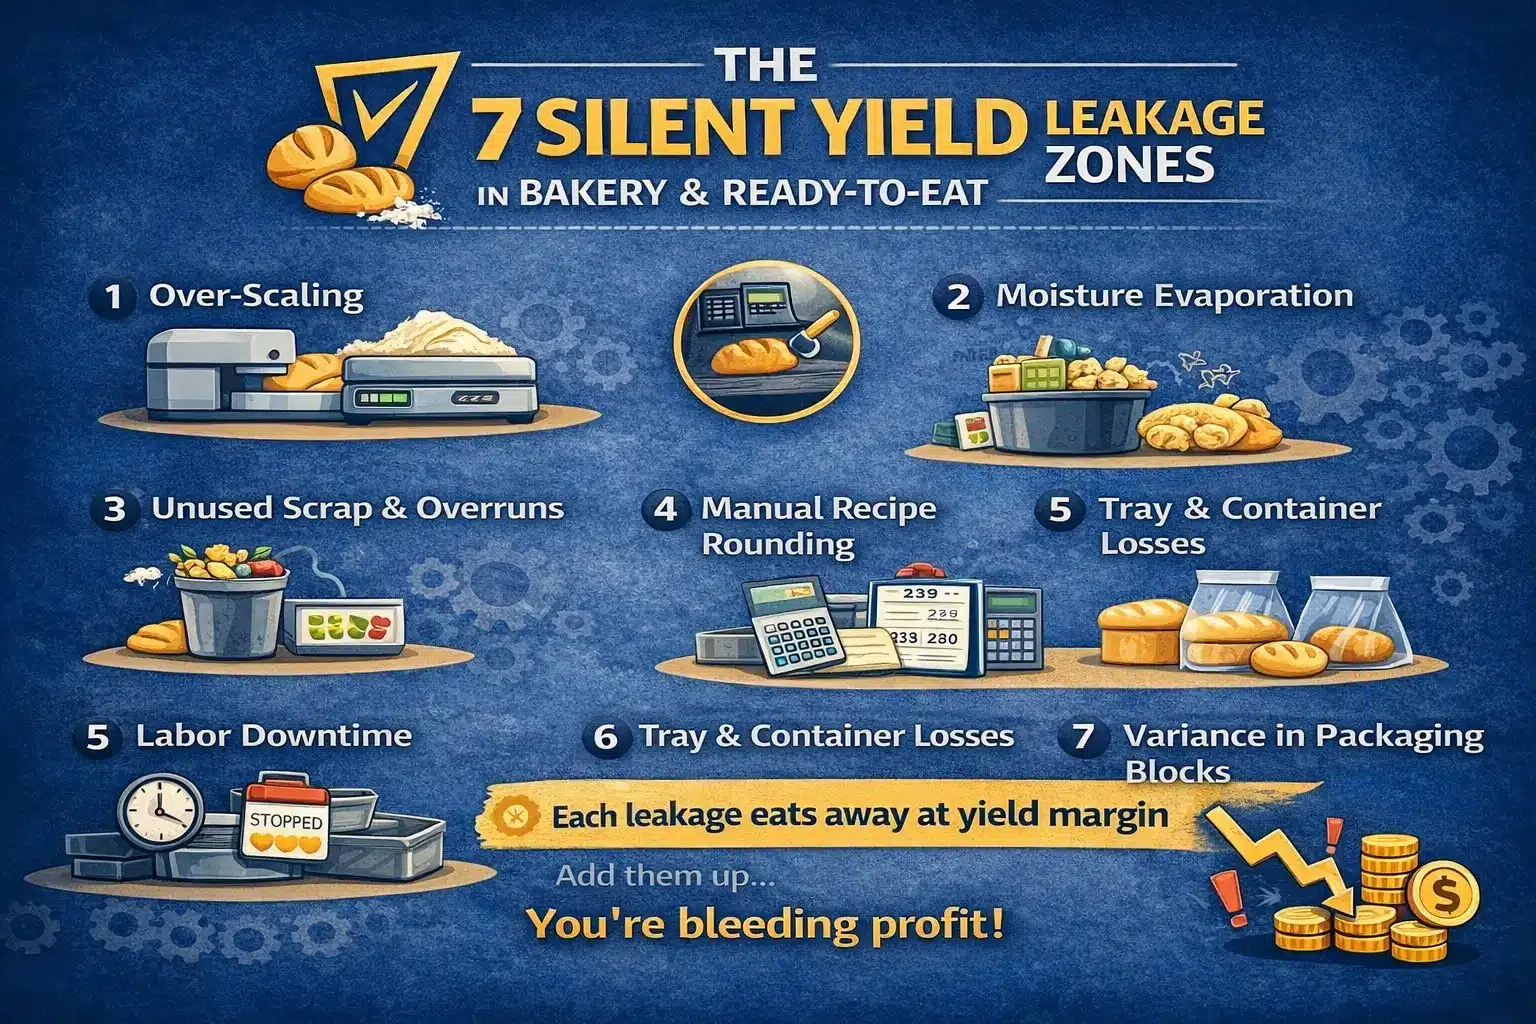
Yield losses rarely occur in one dramatic event. They occur in small, repeated deviations.
1. Pre-Production Scaling Variance
Manual weighing errors are common.
-
50–100 grams over per batch
-
Operator judgment instead of calibrated control
-
Inconsistent measurement tools
If you run 50 batches daily and over-issue 0.5 kg per batch:
0.5 kg × 50 = 25 kg/day
If flour costs $0.45/kg:
25 kg × $0.45 = $11.25/day
Annual loss: $4,106+ per production line
That is just flour.
2. Moisture Loss & Baking Shrinkage Miscalculation
Dough weight does not equal baked weight.
Common issues:
-
No dynamic yield factor per SKU
-
Seasonal humidity not adjusted
-
Fixed recipe assumption despite real variance
A product designed at 92% yield may operate at 88% in summer.
Without tracking, cost distortion continues unnoticed.
3. Trim Waste & Shape Standardization Loss
In bakery production:
-
Crust trimming
-
Portion cutting inconsistencies
-
Tray overfilling in RTE meals
These are often categorized under “normal loss.”
But normal loss must be measured.
4. Rework & Reprocessing Costs
Broken items reused.
Unsold returns reprocessed.
But rarely:
-
Is rework quantity tracked?
-
Is cost absorbed properly?
-
Is reprocessed material valued correctly?
Rework without cost capture distorts margin reporting.
5. Unrecorded Floor Waste
Spillage.
Transfer loss.
Cleaning loss.
These are treated as “minor.”
But minor × 365 days = major.
6. Batch Mixing Deviations
Ingredient substitutions during shortages:
-
Oil replaced with lower-grade alternative
-
Additives adjusted
-
Flavor balance altered
Cost changes are rarely reflected immediately.
Margin reporting becomes inaccurate.
7. Finished Goods Rejection & QC Failures
Burnt batches.
Texture inconsistency.
Packaging errors.
Expiry mismanagement.
Without proper recording:
-
Waste appears as “adjustment”
-
Not as yield loss
Key Takeaway: Yield leakage hides in daily operations, not in accounting reports.
How Poor Yield Tracking Destroys Margin in Food Manufacturing
The Margin Illusion Problem
Revenue grows.
COGS increases silently.
Profit shrinks.
If yield drops from 92% to 88%:
Raw material usage increases by approximately 4.5%.
In a $5M operation, that can reduce gross margin by 2–3%.
For CFO-level stakeholders, this is significant.
3 Financial Distortions Caused by Poor Yield Control
-
Incorrect Product Costing
Standard cost does not reflect actual consumption. -
Wrong Pricing Decisions
Pricing is based on assumed yield, not real yield. -
Inaccurate Inventory Valuation
Stock appears correct on paper but not operationally.
| Issue | Financial Impact |
|---|---|
| 4% Yield Drop | 2–3% Margin Loss |
| Under-recorded Scrap | Inflated Profit |
| Misaligned BOM | Costing Errors |
Key Takeaway: Yield tracking directly protects margin in food manufacturing.
Why Spreadsheets Fail at Yield Tracking
Spreadsheets are static. Production is dynamic.
Limitations:
-
No batch-level traceability
-
No real-time variance alerts
-
No integration with inventory
-
No linkage to accounting
-
No QC integration
-
No SKU benchmarking
Historical yield trends remain invisible.
When margin declines, teams manually search for answers.
Yield control is not a data-entry problem. It’s a systems problem.
Structured Yield Tracking Framework for Mid-Size Food Manufacturers
A practical approach requires structure.
Step 1 – Standardize BOM with Realistic Yield %
-
Separate baking yield factor
-
Adjust moisture loss per SKU
-
Multi-level BOM for RTE
Step 2 – Batch-Level Production Recording
-
Raw material issue vs output receipt
-
Scrap capture per batch
-
Rework recording
| Batch | Input | Output | Scrap | Yield % |
|---|---|---|---|---|
| B001 | 100kg | 90kg | 2kg | 90% |
Step 3 – Variance Threshold Alerts
-
2% deviation auto-flag
-
Shift-level accountability
-
Operator-level reporting
Step 4 – Yield Trend Analytics
-
SKU-wise comparison
-
Line-wise performance
-
Shift-wise variance
Patterns become visible within weeks.
Step 5 – Integrated Cost Impact Analysis
-
Real-time cost per batch
-
Updated gross margin
-
SKU profitability dashboard
This level of control requires:
-
Batch tracking
-
Integrated inventory
-
Automated costing engine
-
Production variance reports
Key Takeaway: Structured yield tracking turns operations into measurable financial control.
How ERP-Based Yield Tracking Changes the Game
When production, inventory, QC, and accounting work together, visibility improves immediately.
With ERP-based yield tracking:
-
Input vs output is recorded in real time
-
Scrap & rework are captured automatically
-
Cost updates dynamically
-
Batch traceability supports compliance (e.g., FDA, FSSAI)
-
SKU-level profitability becomes visible
Specifically:
-
Batch tracking
-
Production planning
-
QC checkpoints
-
Integrated accounting
-
Automated gross margin reporting
If you want to understand structured batch traceability, see FDA guidance on food traceability requirements:
When yield becomes visible, control follows.
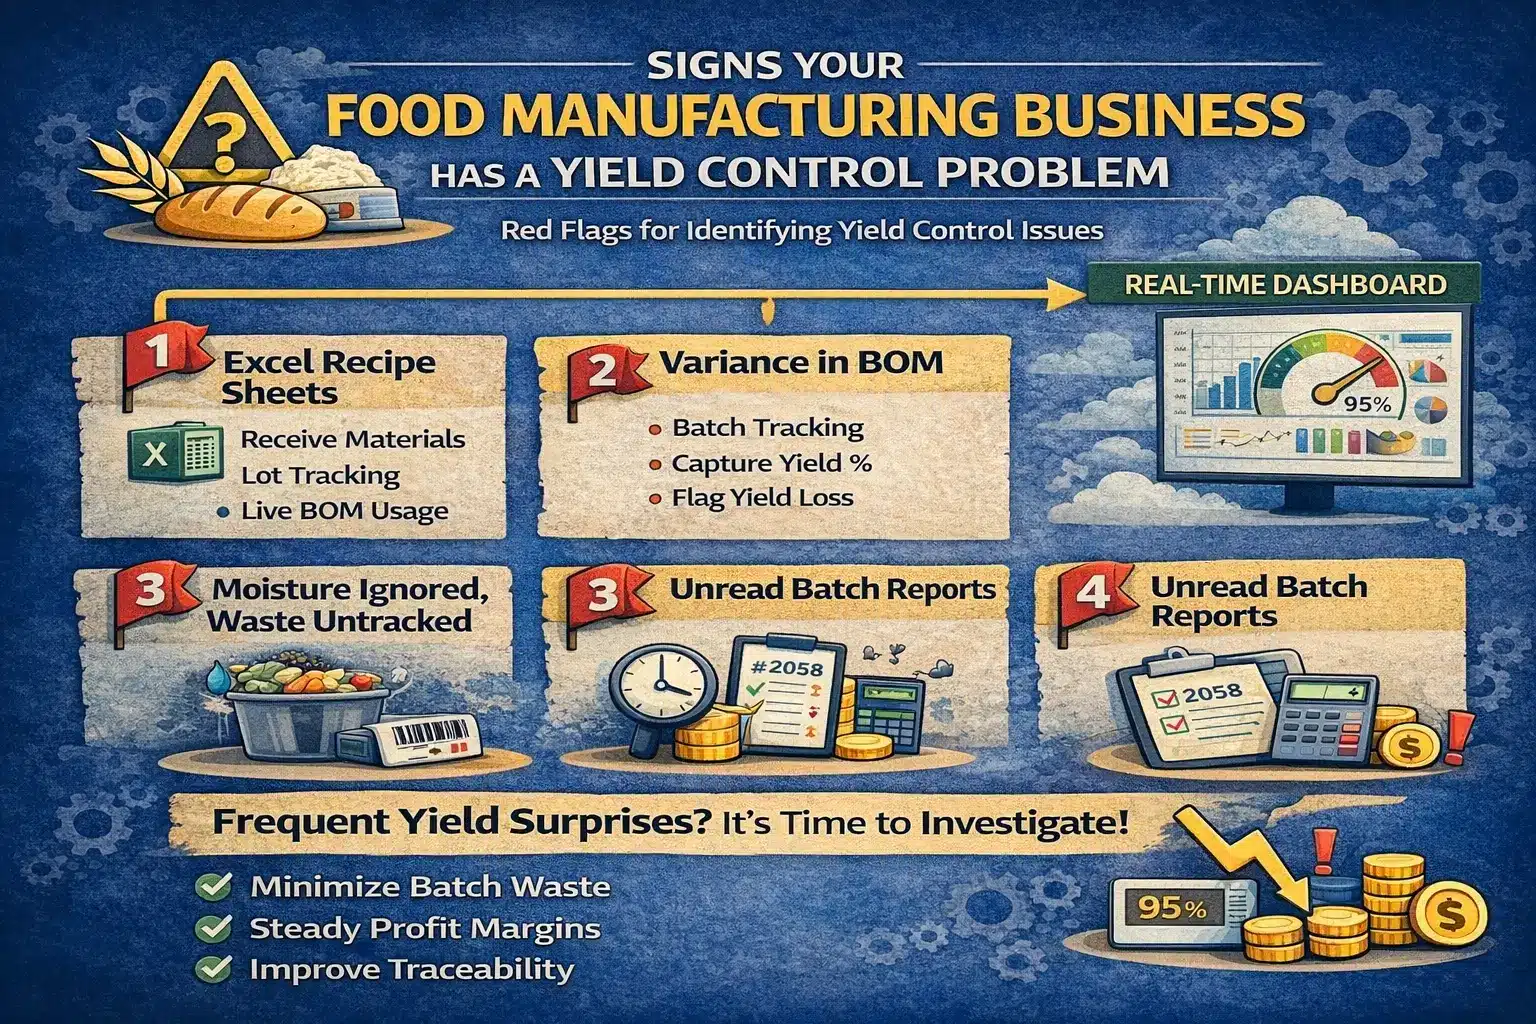
Signs Your Food Manufacturing Business Has a Yield Control Problem
-
Monthly gross margin fluctuates unexpectedly
-
Raw material consumption does not match sales
-
High “miscellaneous consumption”
-
Frequent stock adjustments
-
Recipe variance between shifts
-
No per-batch yield report available
If you cannot generate a yield variance report per SKU per batch, your control is limited.
Conclusion
Yield is not just an operational metric.
It is a financial control metric.
Without batch-level yield tracking:
-
Margin reporting is incomplete
-
Pricing decisions are risky
-
Inventory valuation is distorted
If your business cannot generate a per-batch yield variance report today, you don’t have yield control — you have yield assumptions.
Book a Yield Control Diagnostic Demo
If you operate a mid-size bakery or ready-to-eat manufacturing unit and want structured yield tracking in food manufacturing:
In a 30-minute ERPNext production walkthrough, we will:
-
Identify 3 hidden leakage points
-
Demonstrate live batch-level variance tracking
-
Show margin visibility per SKU
-
Review scrap & rework control
Mid-size food manufacturers rarely fail due to competition.
They struggle when small yield losses compound silently.
👉 Book Your ERPNext Production Demo
You can also follow us on LinkedIn, or YouTube, for regular updates on digital transformation.
